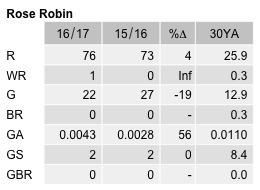
Rose Robin
Petroica rosea
ABR description
The following is extracted from the Annual Bird Report for the twelve months to June 2017.
Uncommon, breeding migrant
Reported more often in the cooler months.
General: The reporting rate of 0.5% is slightly less than last year and 43% down the 30YA, almost the lowest on record (0.4% in 2012). Most records in spring (48%), rather than winter (18%), which is unusual. Records from different widespread areas: mainly MFNR (18), ANU/ANBG (12) and NNP Warks/Blundell Ck Rds (12). No breeding records this year. While the species has been recorded in all but 3 of the previous 30 years, breeding has only been recorded in 9.
GBS: 11 records of single birds from 2 suburban sites. 1 record from Cook (TaN1) and 1 from Curtin (AjR1). Recorded in winter (36%), spring (18%) and autumn (46%). Abundance is higher than last year, and is just above the 10YA, but 61% down on the 30YA.
Abundance
Abundance is the average number of birds of that species per survey. Where the species was observed (presence recorded) but the number of birds seen was not recorded, this is treated as a count of zero.
Abundance by year
This chart shows the abundance of Rose Robin between 1982 and 2017. 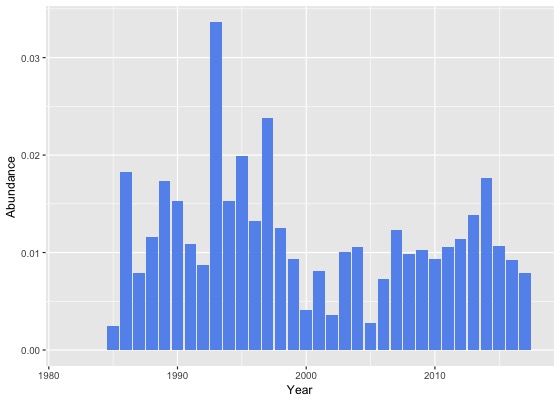
Abundance by month
This chart shows the monthly abundance of Rose Robin. The blue lines show the abundance for the twelve months to June 2017 and the bars show the average abundance for the period 1982 to 2017. 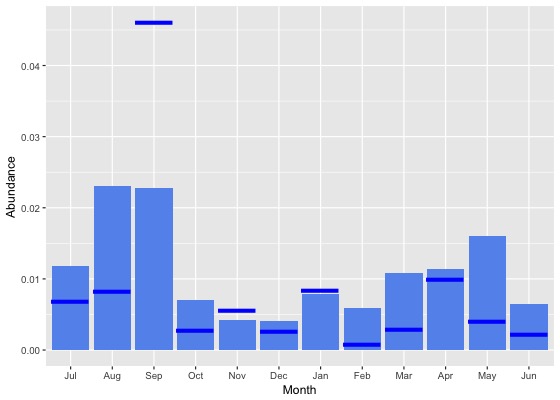
Abundance by season
This chart shows the seasonal abundance of Rose Robin. The blue lines show the seasonal abundance for the twelve months to June 2017 and the bars show the average seasonal abundance for the period 1982 to 2017. 
Abundance data
| Month | Season | ||||||||||||||||||
|---|---|---|---|---|---|---|---|---|---|---|---|---|---|---|---|---|---|---|---|
| Period | Jul | Aug | Sep | Oct | Nov | Dec | Jan | Feb | Mar | Apr | May | Jun | Winter | Spring | Summer | Autumn | All | ||
| All years | |||||||||||||||||||
| All | 0.0 | 0.0 | 0.0 | 0.0 | 0.0 | 0.0 | 0.0 | 0.0 | 0.0 | 0.0 | 0.0 | 0.0 | 0.0 | 0.0 | 0.0 | 0.0 | 0.0 | ||
| Previous years | |||||||||||||||||||
| All previous years | 0.0 | 0.0 | 0.0 | 0.0 | 0.0 | 0.0 | 0.0 | 0.0 | 0.0 | 0.0 | 0.0 | 0.0 | 0.0 | 0.0 | 0.0 | 0.0 | 0.0 | ||
| Previous 30 years | 0.0 | 0.0 | 0.0 | 0.0 | 0.0 | 0.0 | 0.0 | 0.0 | 0.0 | 0.0 | 0.0 | 0.0 | 0.0 | 0.0 | 0.0 | 0.0 | 0.0 | ||
| Previous 20 years | 0.0 | 0.0 | 0.0 | 0.0 | 0.0 | 0.0 | 0.0 | 0.0 | 0.0 | 0.0 | 0.0 | 0.0 | 0.0 | 0.0 | 0.0 | 0.0 | 0.0 | ||
| 10 year groups | |||||||||||||||||||
| [2007,2017) | 0.0 | 0.0 | 0.0 | 0.0 | 0.0 | 0.0 | 0.0 | 0.0 | 0.0 | 0.0 | 0.0 | 0.0 | 0.0 | 0.0 | 0.0 | 0.0 | 0.0 | ||
| [1997,2007) | 0.0 | 0.0 | 0.0 | 0.0 | 0.0 | 0.0 | 0.0 | 0.0 | 0.0 | 0.0 | 0.0 | 0.0 | 0.0 | 0.0 | 0.0 | 0.0 | 0.0 | ||
| [1987,1997) | 0.0 | 0.0 | 0.0 | 0.0 | 0.0 | 0.0 | 0.0 | 0.0 | 0.0 | 0.0 | 0.0 | 0.0 | 0.0 | 0.0 | 0.0 | 0.0 | 0.0 | ||
| 5 year groups | |||||||||||||||||||
| [2012,2017) | 0.0 | 0.0 | 0.0 | 0.0 | 0.0 | 0.0 | 0.0 | 0.0 | 0.0 | 0.0 | 0.0 | 0.0 | 0.0 | 0.0 | 0.0 | 0.0 | 0.0 | ||
| [2007,2012) | 0.0 | 0.0 | 0.0 | 0.0 | 0.0 | 0.0 | 0.0 | 0.0 | 0.0 | 0.0 | 0.0 | 0.0 | 0.0 | 0.0 | 0.0 | 0.0 | 0.0 | ||
| [2002,2007) | 0.0 | 0.0 | 0.0 | 0.0 | 0.0 | 0.0 | 0.0 | 0.0 | 0.0 | 0.0 | 0.0 | 0.0 | 0.0 | 0.0 | 0.0 | 0.0 | 0.0 | ||
| [1997,2002) | 0.0 | 0.0 | 0.0 | 0.0 | 0.0 | 0.0 | 0.0 | 0.0 | 0.0 | 0.0 | 0.0 | 0.0 | 0.0 | 0.0 | 0.0 | 0.0 | 0.0 | ||
| [1992,1997) | 0.0 | 0.0 | 0.0 | 0.0 | 0.0 | 0.0 | 0.0 | 0.0 | 0.0 | 0.0 | 0.0 | 0.0 | 0.0 | 0.0 | 0.0 | 0.0 | 0.0 | ||
| [1987,1992) | 0.0 | 0.0 | 0.0 | 0.0 | 0.0 | 0.0 | 0.0 | 0.0 | 0.0 | 0.0 | 0.0 | 0.0 | 0.0 | 0.0 | 0.0 | 0.0 | 0.0 | ||
| Year | |||||||||||||||||||
| 2017 | 0.0 | 0.0 | 0.0 | 0.0 | 0.0 | 0.0 | 0.0 | 0.0 | 0.0 | 0.0 | 0.0 | 0.0 | 0.0 | 0.0 | 0.0 | 0.0 | 0.0 | ||
| 2016 | 0.0 | 0.0 | 0.0 | 0.0 | 0.0 | 0.0 | 0.0 | 0.0 | 0.0 | 0.0 | 0.0 | 0.0 | 0.0 | 0.0 | 0.0 | 0.0 | 0.0 | ||
| 2015 | 0.0 | 0.0 | 0.0 | 0.0 | 0.0 | 0.0 | 0.0 | 0.0 | 0.0 | 0.0 | 0.0 | 0.0 | 0.0 | 0.0 | 0.0 | 0.0 | 0.0 | ||
| 2014 | 0.0 | 0.0 | 0.0 | 0.0 | 0.0 | 0.0 | 0.0 | 0.0 | 0.1 | 0.0 | 0.1 | 0.0 | 0.0 | 0.0 | 0.0 | 0.0 | 0.0 | ||
| 2013 | 0.1 | 0.0 | 0.0 | 0.0 | 0.0 | 0.0 | 0.0 | 0.0 | 0.0 | 0.0 | 0.1 | 0.0 | 0.0 | 0.0 | 0.0 | 0.0 | 0.0 | ||
| 2012 | 0.0 | 0.0 | 0.0 | 0.0 | 0.0 | 0.0 | 0.0 | 0.0 | 0.0 | 0.0 | 0.0 | 0.0 | 0.0 | 0.0 | 0.0 | 0.0 | 0.0 | ||
| 2011 | 0.0 | 0.0 | 0.0 | 0.0 | 0.0 | 0.0 | 0.0 | 0.0 | 0.0 | 0.0 | 0.0 | 0.0 | 0.0 | 0.0 | 0.0 | 0.0 | 0.0 | ||
| 2010 | 0.0 | 0.0 | 0.0 | 0.0 | 0.0 | 0.0 | 0.0 | 0.0 | 0.0 | 0.0 | 0.0 | 0.0 | 0.0 | 0.0 | 0.0 | 0.0 | 0.0 | ||
| 2009 | 0.0 | 0.0 | 0.1 | 0.0 | 0.0 | 0.0 | 0.0 | 0.0 | 0.0 | 0.0 | 0.0 | 0.0 | 0.0 | 0.0 | 0.0 | 0.0 | 0.0 | ||
| 2008 | 0.0 | 0.0 | 0.0 | 0.0 | 0.0 | 0.0 | 0.0 | 0.0 | 0.0 | 0.0 | 0.0 | 0.0 | 0.0 | 0.0 | 0.0 | 0.0 | 0.0 | ||
| 2007 | 0.1 | 0.1 | 0.0 | 0.0 | 0.0 | 0.0 | 0.0 | 0.0 | 0.0 | 0.0 | 0.0 | 0.0 | 0.0 | 0.0 | 0.0 | 0.0 | 0.0 | ||
| 2006 | 0.0 | 0.0 | 0.0 | 0.0 | 0.0 | 0.0 | 0.0 | 0.0 | 0.0 | 0.0 | 0.0 | 0.0 | 0.0 | 0.0 | 0.0 | 0.0 | 0.0 | ||
| 2005 | 0.0 | 0.0 | 0.0 | 0.0 | 0.0 | 0.0 | 0.0 | 0.0 | 0.0 | 0.0 | 0.0 | 0.0 | 0.0 | 0.0 | 0.0 | 0.0 | 0.0 | ||
| 2004 | 0.0 | 0.0 | 0.0 | 0.0 | 0.0 | 0.0 | 0.0 | 0.0 | 0.0 | 0.0 | 0.0 | 0.0 | 0.0 | 0.0 | 0.0 | 0.0 | 0.0 | ||
| 2003 | 0.0 | 0.1 | 0.0 | 0.0 | 0.0 | 0.0 | 0.0 | 0.0 | 0.0 | 0.0 | 0.0 | 0.0 | 0.0 | 0.0 | 0.0 | 0.0 | 0.0 | ||
| 2002 | 0.0 | 0.0 | 0.0 | 0.0 | 0.0 | 0.0 | 0.0 | 0.0 | 0.0 | 0.0 | 0.0 | 0.0 | 0.0 | 0.0 | 0.0 | 0.0 | 0.0 | ||
| 2001 | 0.0 | 0.0 | 0.0 | 0.0 | 0.0 | 0.0 | 0.0 | 0.0 | 0.0 | 0.0 | 0.0 | 0.0 | 0.0 | 0.0 | 0.0 | 0.0 | 0.0 | ||
| 2000 | 0.0 | 0.0 | 0.0 | 0.0 | 0.0 | 0.0 | 0.0 | 0.0 | 0.0 | 0.0 | 0.0 | 0.0 | 0.0 | 0.0 | 0.0 | 0.0 | 0.0 | ||
| 1999 | 0.0 | 0.0 | 0.0 | 0.0 | 0.0 | 0.0 | 0.0 | 0.0 | 0.0 | 0.0 | 0.0 | 0.0 | 0.0 | 0.0 | 0.0 | 0.0 | 0.0 | ||
| 1998 | 0.0 | 0.1 | 0.0 | 0.0 | 0.0 | 0.0 | 0.0 | 0.0 | 0.0 | 0.0 | 0.0 | 0.0 | 0.0 | 0.0 | 0.0 | 0.0 | 0.0 | ||
| 1997 | 0.0 | 0.0 | 0.0 | 0.0 | 0.0 | 0.0 | 0.0 | 0.0 | 0.1 | 0.0 | 0.1 | 0.0 | 0.0 | 0.0 | 0.0 | 0.1 | 0.0 | ||
| 1996 | 0.0 | 0.0 | 0.0 | 0.0 | 0.0 | 0.0 | 0.0 | 0.0 | 0.0 | 0.0 | 0.0 | 0.0 | 0.0 | 0.0 | 0.0 | 0.0 | 0.0 | ||
| 1995 | 0.0 | 0.0 | 0.0 | 0.0 | 0.0 | 0.0 | 0.0 | 0.0 | 0.0 | 0.0 | 0.0 | 0.0 | 0.0 | 0.0 | 0.0 | 0.0 | 0.0 | ||
| 1994 | 0.0 | 0.0 | 0.0 | 0.0 | 0.0 | 0.0 | 0.0 | 0.1 | 0.0 | 0.0 | 0.0 | 0.1 | 0.0 | 0.0 | 0.0 | 0.0 | 0.0 | ||
| 1993 | 0.0 | 0.0 | 0.0 | 0.0 | 0.0 | 0.0 | 0.0 | 0.0 | 0.1 | 0.0 | 0.1 | 0.0 | 0.0 | 0.0 | 0.0 | 0.1 | 0.0 | ||
| 1992 | 0.0 | 0.0 | 0.0 | 0.1 | 0.0 | 0.0 | 0.0 | 0.0 | 0.0 | 0.0 | 0.0 | 0.0 | 0.0 | 0.0 | 0.0 | 0.0 | 0.0 | ||
| 1991 | 0.0 | 0.0 | 0.0 | 0.0 | 0.0 | 0.0 | 0.0 | 0.0 | 0.0 | 0.0 | 0.0 | 0.0 | 0.0 | 0.0 | 0.0 | 0.0 | 0.0 | ||
| 1990 | 0.0 | 0.0 | 0.0 | 0.0 | 0.0 | 0.0 | 0.0 | 0.0 | 0.0 | 0.0 | 0.0 | 0.0 | 0.0 | 0.0 | 0.0 | 0.0 | 0.0 | ||
| 1989 | 0.0 | 0.0 | 0.0 | 0.0 | 0.0 | 0.0 | 0.0 | 0.0 | 0.0 | 0.0 | 0.0 | 0.0 | 0.0 | 0.0 | 0.0 | 0.0 | 0.0 | ||
| 1988 | 0.0 | 0.0 | 0.0 | 0.0 | 0.0 | 0.0 | 0.0 | 0.0 | 0.0 | 0.0 | 0.0 | 0.0 | 0.0 | 0.0 | 0.0 | 0.0 | 0.0 | ||
| 1987 | 0.1 | 0.0 | 0.0 | 0.0 | 0.0 | 0.0 | 0.0 | 0.0 | 0.0 | 0.0 | 0.0 | 0.0 | 0.0 | 0.0 | 0.0 | 0.0 | 0.0 | ||
| 1986 | 0.0 | 0.0 | 0.1 | 0.0 | 0.0 | 0.0 | 0.0 | 0.0 | 0.0 | 0.0 | 0.0 | 0.0 | 0.0 | 0.0 | 0.0 | 0.0 | 0.0 | ||
| 1985 | 0.0 | 0.0 | 0.0 | 0.0 | 0.0 | 0.0 | 0.0 | 0.0 | 0.0 | 0.1 | 0.0 | 0.0 | 0.0 | 0.0 | 0.0 | 0.0 | 0.0 | ||
| 1984 | 0.0 | 0.0 | 0.0 | 0.0 | 0.0 | 0.0 | 0.0 | 0.0 | 0.0 | 0.0 | 0.0 | 0.0 | 0.0 | 0.0 | 0.0 | 0.0 | 0.0 | ||
| 1983 | 0.0 | 0.0 | 0.0 | 0.0 | 0.0 | 0.0 | 0.0 | 0.0 | 0.0 | - | 0.0 | 0.0 | 0.0 | 0.0 | 0.0 | 0.0 | 0.0 | ||
| 1982 | - | 0.0 | - | 0.0 | 0.0 | 0.0 | - | 0.0 | - | 0.0 | - | 0.0 | 0.0 | 0.0 | 0.0 | 0.0 | 0.0 | ||
Reporting rates
Reporting rate is the proportion of all surveys in which the species was present.
Reporting rate by year
This chart shows the reporting rate of Rose Robin each year between 1982 and 2017. 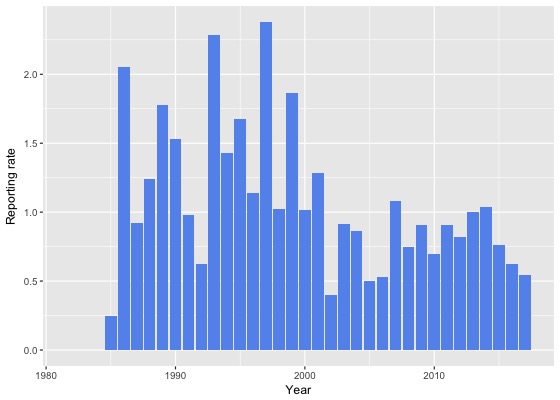
Reporting rate by month
This chart shows the reporting rate by month of Rose Robin. The blue lines show the reporting rate for the twelve months to June 2017 and the bars show the average reporting rate for the period 1982 to 2017. 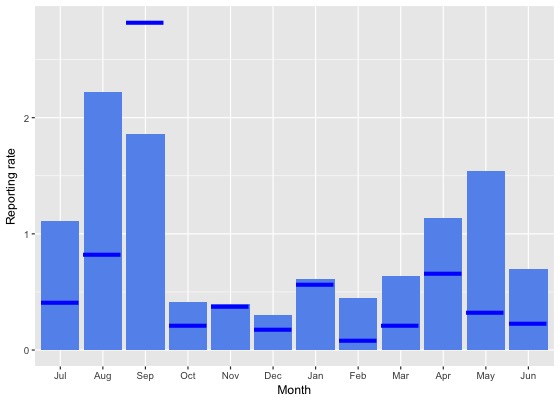
Reporting rate by season
This chart shows the seasonal reporting rate of Rose Robin. The blue lines show the seasonal reporting rate for the twelve months to June 2017 and the bars show the average seasonal reporting rate for the period 1982 to 2017. 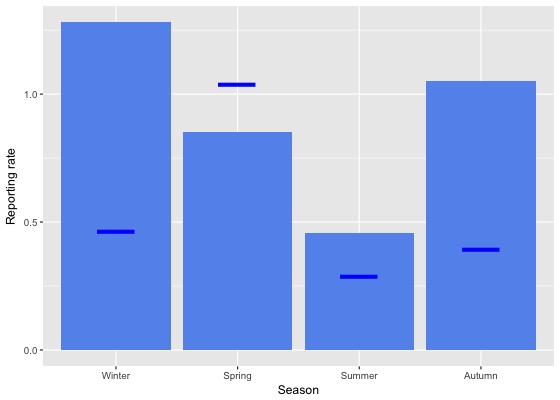
Reporting rate data
| Month | Season | ||||||||||||||||||
|---|---|---|---|---|---|---|---|---|---|---|---|---|---|---|---|---|---|---|---|
| Period | Jul | Aug | Sep | Oct | Nov | Dec | Jan | Feb | Mar | Apr | May | Jun | Winter | Spring | Summer | Autumn | All | ||
| All years | |||||||||||||||||||
| All | 1.1 | 2.2 | 1.9 | 0.4 | 0.4 | 0.3 | 0.6 | 0.5 | 0.6 | 1.1 | 1.5 | 0.7 | 1.3 | 0.9 | 0.5 | 1.1 | 0.9 | ||
| Previous years | |||||||||||||||||||
| All previous years | 1.2 | 2.5 | 1.7 | 0.4 | 0.4 | 0.3 | 0.6 | 0.5 | 0.7 | 1.2 | 1.8 | 0.8 | 1.4 | 0.8 | 0.5 | 1.2 | 0.9 | ||
| Previous 30 years | 1.2 | 2.5 | 1.7 | 0.4 | 0.4 | 0.3 | 0.6 | 0.5 | 0.7 | 1.2 | 1.9 | 0.8 | 1.4 | 0.8 | 0.5 | 1.2 | 0.9 | ||
| Previous 20 years | 1.3 | 2.4 | 1.6 | 0.3 | 0.3 | 0.3 | 0.5 | 0.4 | 0.5 | 1.1 | 1.9 | 0.7 | 1.4 | 0.7 | 0.4 | 1.1 | 0.9 | ||
| 10 year groups | |||||||||||||||||||
| [2007,2017) | 1.6 | 2.3 | 1.5 | 0.4 | 0.3 | 0.3 | 0.6 | 0.4 | 0.5 | 0.9 | 1.6 | 0.6 | 1.4 | 0.7 | 0.5 | 0.9 | 0.8 | ||
| [1997,2007) | 0.9 | 2.5 | 1.9 | 0.1 | 0.5 | 0.4 | 0.3 | 0.5 | 0.6 | 1.7 | 2.5 | 0.9 | 1.3 | 0.9 | 0.4 | 1.4 | 1.0 | ||
| [1987,1997) | 1.0 | 2.9 | 2.1 | 1.1 | 0.6 | 0.3 | 1.2 | 1.0 | 1.7 | 1.5 | 1.7 | 1.3 | 1.7 | 1.2 | 0.8 | 1.6 | 1.3 | ||
| 5 year groups | |||||||||||||||||||
| [2012,2017) | 1.8 | 2.2 | 1.3 | 0.4 | 0.2 | 0.4 | 0.5 | 0.4 | 0.5 | 0.9 | 1.6 | 0.8 | 1.5 | 0.6 | 0.4 | 0.9 | 0.8 | ||
| [2007,2012) | 1.0 | 2.7 | 2.0 | 0.4 | 0.3 | 0.2 | 1.1 | 0.6 | 0.6 | 1.0 | 1.6 | 0.4 | 1.0 | 0.8 | 0.6 | 1.0 | 0.9 | ||
| [2002,2007) | 0.8 | 2.4 | 1.9 | 0.2 | 0.1 | 0.0 | 0.0 | 0.2 | 0.5 | 0.9 | 0.8 | 0.4 | 1.0 | 0.8 | 0.0 | 0.7 | 0.6 | ||
| [1997,2002) | 1.0 | 2.7 | 1.8 | 0.0 | 0.9 | 0.8 | 0.6 | 0.8 | 0.8 | 2.7 | 4.7 | 1.6 | 1.7 | 0.9 | 0.7 | 2.4 | 1.4 | ||
| [1992,1997) | 1.2 | 3.5 | 1.5 | 0.6 | 0.4 | 0.0 | 1.0 | 1.4 | 1.4 | 1.6 | 2.7 | 2.0 | 2.3 | 0.8 | 0.8 | 1.8 | 1.4 | ||
| [1987,1992) | 0.8 | 2.5 | 2.4 | 1.4 | 0.7 | 0.4 | 1.3 | 0.8 | 1.9 | 1.4 | 1.1 | 0.9 | 1.4 | 1.4 | 0.8 | 1.5 | 1.3 | ||
| Year | |||||||||||||||||||
| 2017 | 0.4 | 0.8 | 2.8 | 0.2 | 0.4 | 0.2 | 0.6 | 0.1 | 0.2 | 0.7 | 0.3 | 0.2 | 0.5 | 1.0 | 0.3 | 0.4 | 0.5 | ||
| 2016 | 1.4 | 2.0 | 2.2 | 0.2 | 0.0 | 0.0 | 0.3 | 0.2 | 0.2 | 0.6 | 0.6 | 0.5 | 1.3 | 0.8 | 0.2 | 0.4 | 0.6 | ||
| 2015 | 1.2 | 2.9 | 0.6 | 0.4 | 0.2 | 0.6 | 0.4 | 0.7 | 0.4 | 1.2 | 1.2 | 0.7 | 1.4 | 0.4 | 0.6 | 0.9 | 0.8 | ||
| 2014 | 0.0 | 2.1 | 0.8 | 0.5 | 0.4 | 1.1 | 0.7 | 0.5 | 1.4 | 0.8 | 4.4 | 1.0 | 1.1 | 0.5 | 0.7 | 1.9 | 1.0 | ||
| 2013 | 5.9 | 2.3 | 1.4 | 0.3 | 0.5 | 0.2 | 0.4 | 0.6 | 0.4 | 0.9 | 3.3 | 0.4 | 2.6 | 0.7 | 0.3 | 1.2 | 1.0 | ||
| 2012 | 1.2 | 2.0 | 0.7 | 0.7 | 0.5 | 0.5 | 0.5 | 0.0 | 0.3 | 1.1 | 1.6 | 1.5 | 1.5 | 0.7 | 0.4 | 0.9 | 0.8 | ||
| 2011 | 1.6 | 1.6 | 2.7 | 0.2 | 0.0 | 0.0 | 0.9 | 0.0 | 0.6 | 1.3 | 2.2 | 0.9 | 1.2 | 0.9 | 0.3 | 1.3 | 0.9 | ||
| 2010 | 1.0 | 3.5 | 0.4 | 0.4 | 0.0 | 0.4 | 0.0 | 0.0 | 0.4 | 1.7 | 2.9 | 0.4 | 1.3 | 0.3 | 0.2 | 1.4 | 0.7 | ||
| 2009 | 0.0 | 1.0 | 4.9 | 0.2 | 0.4 | 0.0 | 1.3 | 0.8 | 1.4 | 0.4 | 0.0 | 0.0 | 0.2 | 1.5 | 0.7 | 0.7 | 0.9 | ||
| 2008 | 0.0 | 1.7 | 0.7 | 0.7 | 1.3 | 0.9 | 1.6 | 0.0 | 0.0 | 0.9 | 1.8 | 0.0 | 0.4 | 0.8 | 0.9 | 0.8 | 0.7 | ||
| 2007 | 3.3 | 5.6 | 1.2 | 0.7 | 0.0 | 0.0 | 2.0 | 2.6 | 0.4 | 0.9 | 0.8 | 0.3 | 2.0 | 0.7 | 1.2 | 0.7 | 1.1 | ||
| 2006 | 0.0 | 0.0 | 1.8 | 0.3 | 0.0 | 0.0 | 0.0 | 0.7 | 0.6 | 1.1 | 1.4 | 0.4 | 0.2 | 0.6 | 0.2 | 0.9 | 0.5 | ||
| 2005 | 1.5 | 0.9 | 1.1 | 0.0 | 0.0 | 0.0 | 0.0 | 0.0 | 0.4 | 1.1 | 0.0 | 0.8 | 1.0 | 0.5 | 0.0 | 0.5 | 0.5 | ||
| 2004 | 0.8 | 3.3 | 3.4 | 0.6 | 0.0 | 0.0 | 0.0 | 0.0 | 0.0 | 0.5 | 1.0 | 0.6 | 1.4 | 1.4 | 0.0 | 0.4 | 0.9 | ||
| 2003 | 2.6 | 5.0 | 2.5 | 0.0 | 0.0 | 0.0 | 0.0 | 0.0 | 0.9 | 0.9 | 0.0 | 0.0 | 2.4 | 0.9 | 0.0 | 0.7 | 0.9 | ||
| 2002 | 0.0 | 1.7 | 1.0 | 0.0 | 0.5 | 0.0 | 0.0 | 0.0 | 0.5 | 0.6 | 2.4 | 0.0 | 0.4 | 0.5 | 0.0 | 0.8 | 0.4 | ||
| 2001 | 0.0 | 4.8 | 1.2 | 0.0 | 1.1 | 1.1 | 0.5 | 0.0 | 0.9 | 2.4 | 3.5 | 1.5 | 1.9 | 0.8 | 0.6 | 2.0 | 1.3 | ||
| 2000 | 1.6 | 0.7 | 0.0 | 0.0 | 0.9 | 1.0 | 0.0 | 0.5 | 0.4 | 4.4 | 2.7 | 1.1 | 1.1 | 0.3 | 0.5 | 2.4 | 1.0 | ||
| 1999 | 0.0 | 2.1 | 2.9 | 0.0 | 0.6 | 1.2 | 2.2 | 2.9 | 0.0 | 1.5 | 5.7 | 1.9 | 1.7 | 1.2 | 2.1 | 2.3 | 1.9 | ||
| 1998 | 2.7 | 3.8 | 2.4 | 0.0 | 0.9 | 0.0 | 0.0 | 0.0 | 0.0 | 0.0 | 3.7 | 1.3 | 2.4 | 1.2 | 0.0 | 0.6 | 1.0 | ||
| 1997 | 2.3 | 1.7 | 4.5 | 0.0 | 0.9 | 0.0 | 0.0 | 0.0 | 7.5 | 2.8 | 11.1 | 2.8 | 2.3 | 2.0 | 0.0 | 5.7 | 2.4 | ||
| 1996 | 0.0 | 4.3 | 0.0 | 0.0 | 0.0 | 0.0 | 0.0 | 2.4 | 2.0 | 0.0 | 3.4 | 2.3 | 2.4 | 0.0 | 0.7 | 1.8 | 1.1 | ||
| 1995 | 2.2 | 4.7 | 2.9 | 0.0 | 0.9 | 0.0 | 1.8 | 0.0 | 0.0 | 2.4 | 2.6 | 2.1 | 3.2 | 1.1 | 0.8 | 1.7 | 1.7 | ||
| 1994 | 2.0 | 3.9 | 0.0 | 0.0 | 0.7 | 0.0 | 0.0 | 3.4 | 0.0 | 2.3 | 1.2 | 3.4 | 3.2 | 0.3 | 1.2 | 1.3 | 1.4 | ||
| 1993 | 2.0 | 2.6 | 3.2 | 1.3 | 0.0 | 0.0 | 4.1 | 0.0 | 4.9 | 1.7 | 5.2 | 0.0 | 1.5 | 1.5 | 1.6 | 4.1 | 2.3 | ||
| 1992 | 0.0 | 0.0 | 1.2 | 2.1 | 0.0 | 0.0 | 0.0 | 0.0 | 0.0 | 0.0 | 1.3 | 1.7 | 0.6 | 1.2 | 0.0 | 0.5 | 0.6 | ||
| 1991 | 2.4 | 0.0 | 1.2 | 1.9 | 0.0 | 0.0 | 0.0 | 0.0 | 1.6 | 1.7 | 0.0 | 2.0 | 1.5 | 1.0 | 0.0 | 1.1 | 1.0 | ||
| 1990 | 0.0 | 3.2 | 3.2 | 2.0 | 0.9 | 0.0 | 1.4 | 0.0 | 0.0 | 2.4 | 1.4 | 2.6 | 1.9 | 2.0 | 0.5 | 1.2 | 1.5 | ||
| 1989 | 0.0 | 3.0 | 2.6 | 3.1 | 3.0 | 0.9 | 0.5 | 1.5 | 0.6 | 2.1 | 2.6 | 0.6 | 1.3 | 2.9 | 1.0 | 1.7 | 1.8 | ||
| 1988 | 0.9 | 2.2 | 2.2 | 0.8 | 0.0 | 0.5 | 2.5 | 0.0 | 4.5 | 0.5 | 1.0 | 0.0 | 1.1 | 0.8 | 1.1 | 2.0 | 1.2 | ||
| 1987 | 9.1 | 6.7 | 2.4 | 0.0 | 0.0 | 0.0 | 1.0 | 1.2 | 1.4 | 1.2 | 0.4 | 1.0 | 1.7 | 0.7 | 0.8 | 1.0 | 0.9 | ||
| 1986 | 0.0 | 5.3 | 5.7 | 0.0 | 2.1 | 0.0 | 0.0 | 0.0 | 3.2 | 3.9 | 0.0 | 0.0 | 2.0 | 2.9 | 0.0 | 2.7 | 2.1 | ||
| 1985 | 0.0 | 0.0 | 0.0 | 0.0 | 0.0 | 0.0 | 0.0 | 0.0 | 0.0 | 5.3 | 0.0 | 0.0 | 0.0 | 0.0 | 0.0 | 2.5 | 0.2 | ||
| 1984 | 0.0 | 0.0 | 0.0 | 0.0 | 0.0 | 0.0 | 0.0 | 0.0 | 0.0 | 0.0 | 0.0 | 0.0 | 0.0 | 0.0 | 0.0 | 0.0 | 0.0 | ||
| 1983 | 0.0 | 0.0 | 0.0 | 0.0 | 0.0 | 0.0 | 0.0 | 0.0 | 0.0 | - | 0.0 | 0.0 | 0.0 | 0.0 | 0.0 | 0.0 | 0.0 | ||
| 1982 | - | 0.0 | - | 0.0 | 0.0 | 0.0 | - | 0.0 | - | 0.0 | - | 0.0 | 0.0 | 0.0 | 0.0 | 0.0 | 0.0 | ||
Breeding data
Breeding records by month
Number of breeding records by breeding code and month, 2017 and all years| Breeding code | Jul | Aug | Sep | Oct | Nov | Dec | Jan | Feb | Mar | Apr | May | Jun |
|---|---|---|---|---|---|---|---|---|---|---|---|---|
| 2017 | ||||||||||||
| Breeding (BLA code) | 0 | 0 | 0 | 0 | 0 | 0 | 0 | 0 | 0 | 0 | 0 | 0 |
| Carrying Food | 0 | 0 | 0 | 0 | 0 | 0 | 0 | 0 | 0 | 0 | 0 | 0 |
| Copulating | 0 | 0 | 0 | 0 | 0 | 0 | 0 | 0 | 0 | 0 | 0 | 0 |
| Display | 0 | 0 | 0 | 0 | 0 | 0 | 0 | 0 | 0 | 0 | 0 | 0 |
| Dependent young | 0 | 0 | 0 | 0 | 0 | 0 | 0 | 0 | 0 | 0 | 0 | 0 |
| Faecal sac | 0 | 0 | 0 | 0 | 0 | 0 | 0 | 0 | 0 | 0 | 0 | 0 |
| Inspecting hollow | 0 | 0 | 0 | 0 | 0 | 0 | 0 | 0 | 0 | 0 | 0 | 0 |
| Nest building | 0 | 0 | 0 | 0 | 0 | 0 | 0 | 0 | 0 | 0 | 0 | 0 |
| Nest with eggs | 0 | 0 | 0 | 0 | 0 | 0 | 0 | 0 | 0 | 0 | 0 | 0 |
| Nest with young | 0 | 0 | 0 | 0 | 0 | 0 | 0 | 0 | 0 | 0 | 0 | 0 |
| On/leaving nest | 0 | 0 | 0 | 0 | 0 | 0 | 0 | 0 | 0 | 0 | 0 | 0 |
| All years | ||||||||||||
| Breeding (BLA code) | 0 | 0 | 0 | 1 | 0 | 0 | 1 | 0 | 0 | 0 | 0 | 0 |
| Carrying Food | 0 | 0 | 0 | 0 | 0 | 0 | 0 | 0 | 0 | 0 | 0 | 0 |
| Copulating | 0 | 0 | 0 | 0 | 0 | 0 | 0 | 0 | 0 | 0 | 0 | 0 |
| Display | 0 | 0 | 0 | 0 | 0 | 0 | 0 | 0 | 0 | 0 | 0 | 0 |
| Dependent young | 0 | 0 | 0 | 1 | 0 | 0 | 0 | 0 | 0 | 0 | 0 | 0 |
| Faecal sac | 0 | 0 | 0 | 0 | 0 | 0 | 0 | 0 | 0 | 0 | 0 | 0 |
| Inspecting hollow | 0 | 0 | 0 | 0 | 0 | 0 | 0 | 0 | 0 | 0 | 0 | 0 |
| Nest building | 0 | 0 | 0 | 2 | 1 | 0 | 0 | 0 | 0 | 0 | 0 | 0 |
| Nest with eggs | 0 | 0 | 0 | 0 | 0 | 0 | 0 | 0 | 0 | 0 | 0 | 0 |
| Nest with young | 0 | 0 | 0 | 0 | 0 | 0 | 2 | 1 | 0 | 0 | 0 | 0 |
| On/leaving nest | 0 | 0 | 0 | 0 | 0 | 0 | 1 | 0 | 0 | 0 | 0 | 0 |
Breeding records by year
Average number of breeding records per period by breeding code| Period | Breeding (BLA code) | Carrying Food | Copulating | Display | Dependent young | Faecal sac | Inspecting hollow | Nest building | Nest with eggs | Nest with young | On/leaving nest |
|---|---|---|---|---|---|---|---|---|---|---|---|
| All years | |||||||||||
| All | 0.1 | 0.0 | 0.0 | 0.0 | 0.0 | 0.0 | 0.0 | 0.1 | 0.0 | 0.1 | 0.0 |
| Previous years | |||||||||||
| All previous years | 0.1 | 0.0 | 0.0 | 0.0 | 0.0 | 0.0 | 0.0 | 0.1 | 0.0 | 0.1 | 0.0 |
| Previous 30 years | 0.1 | 0.0 | 0.0 | 0.0 | 0.0 | 0.0 | 0.0 | 0.1 | 0.0 | 0.1 | 0.0 |
| Previous 20 years | 0.1 | 0.0 | 0.0 | 0.0 | 0.0 | 0.0 | 0.0 | 0.0 | 0.0 | 0.0 | 0.0 |
| 10 year groups | |||||||||||
| [2007,2017) | 0.2 | 0.0 | 0.0 | 0.0 | 0.0 | 0.0 | 0.0 | 0.0 | 0.0 | 0.1 | 0.0 |
| [1997,2007) | 0.0 | 0.0 | 0.0 | 0.0 | 0.0 | 0.0 | 0.0 | 0.0 | 0.0 | 0.0 | 0.1 |
| [1987,1997) | 0.0 | 0.0 | 0.0 | 0.0 | 0.1 | 0.0 | 0.0 | 0.3 | 0.0 | 0.2 | 0.0 |
| 5 year groups | |||||||||||
| [2012,2017) | 0.2 | 0.0 | 0.0 | 0.0 | 0.0 | 0.0 | 0.0 | 0.0 | 0.0 | 0.2 | 0.0 |
| [2007,2012) | 0.2 | 0.0 | 0.0 | 0.0 | 0.0 | 0.0 | 0.0 | 0.0 | 0.0 | 0.0 | 0.0 |
| [2002,2007) | 0.0 | 0.0 | 0.0 | 0.0 | 0.0 | 0.0 | 0.0 | 0.0 | 0.0 | 0.0 | 0.0 |
| [1997,2002) | 0.0 | 0.0 | 0.0 | 0.0 | 0.0 | 0.0 | 0.0 | 0.0 | 0.0 | 0.0 | 0.2 |
| [1992,1997) | 0.0 | 0.0 | 0.0 | 0.0 | 0.2 | 0.0 | 0.0 | 0.0 | 0.0 | 0.2 | 0.0 |
| [1987,1992) | 0.0 | 0.0 | 0.0 | 0.0 | 0.0 | 0.0 | 0.0 | 0.6 | 0.0 | 0.2 | 0.0 |
| Year | |||||||||||
| 2017 | 0.0 | 0.0 | 0.0 | 0.0 | 0.0 | 0.0 | 0.0 | 0.0 | 0.0 | 0.0 | 0.0 |
| 2016 | 0.0 | 0.0 | 0.0 | 0.0 | 0.0 | 0.0 | 0.0 | 0.0 | 0.0 | 0.0 | 0.0 |
| 2015 | 0.0 | 0.0 | 0.0 | 0.0 | 0.0 | 0.0 | 0.0 | 0.0 | 0.0 | 1.0 | 0.0 |
| 2014 | 0.0 | 0.0 | 0.0 | 0.0 | 0.0 | 0.0 | 0.0 | 0.0 | 0.0 | 0.0 | 0.0 |
| 2013 | 1.0 | 0.0 | 0.0 | 0.0 | 0.0 | 0.0 | 0.0 | 0.0 | 0.0 | 0.0 | 0.0 |
| 2012 | 0.0 | 0.0 | 0.0 | 0.0 | 0.0 | 0.0 | 0.0 | 0.0 | 0.0 | 0.0 | 0.0 |
| 2011 | 0.0 | 0.0 | 0.0 | 0.0 | 0.0 | 0.0 | 0.0 | 0.0 | 0.0 | 0.0 | 0.0 |
| 2010 | 0.0 | 0.0 | 0.0 | 0.0 | 0.0 | 0.0 | 0.0 | 0.0 | 0.0 | 0.0 | 0.0 |
| 2009 | 0.0 | 0.0 | 0.0 | 0.0 | 0.0 | 0.0 | 0.0 | 0.0 | 0.0 | 0.0 | 0.0 |
| 2008 | 0.0 | 0.0 | 0.0 | 0.0 | 0.0 | 0.0 | 0.0 | 0.0 | 0.0 | 0.0 | 0.0 |
| 2007 | 1.0 | 0.0 | 0.0 | 0.0 | 0.0 | 0.0 | 0.0 | 0.0 | 0.0 | 0.0 | 0.0 |
| 2006 | 0.0 | 0.0 | 0.0 | 0.0 | 0.0 | 0.0 | 0.0 | 0.0 | 0.0 | 0.0 | 0.0 |
| 2005 | 0.0 | 0.0 | 0.0 | 0.0 | 0.0 | 0.0 | 0.0 | 0.0 | 0.0 | 0.0 | 0.0 |
| 2004 | 0.0 | 0.0 | 0.0 | 0.0 | 0.0 | 0.0 | 0.0 | 0.0 | 0.0 | 0.0 | 0.0 |
| 2003 | 0.0 | 0.0 | 0.0 | 0.0 | 0.0 | 0.0 | 0.0 | 0.0 | 0.0 | 0.0 | 0.0 |
| 2002 | 0.0 | 0.0 | 0.0 | 0.0 | 0.0 | 0.0 | 0.0 | 0.0 | 0.0 | 0.0 | 0.0 |
| 2001 | 0.0 | 0.0 | 0.0 | 0.0 | 0.0 | 0.0 | 0.0 | 0.0 | 0.0 | 0.0 | 0.0 |
| 2000 | 0.0 | 0.0 | 0.0 | 0.0 | 0.0 | 0.0 | 0.0 | 0.0 | 0.0 | 0.0 | 0.0 |
| 1999 | 0.0 | 0.0 | 0.0 | 0.0 | 0.0 | 0.0 | 0.0 | 0.0 | 0.0 | 0.0 | 1.0 |
| 1998 | 0.0 | 0.0 | 0.0 | 0.0 | 0.0 | 0.0 | 0.0 | 0.0 | 0.0 | 0.0 | 0.0 |
| 1997 | 0.0 | 0.0 | 0.0 | 0.0 | 0.0 | 0.0 | 0.0 | 0.0 | 0.0 | 0.0 | 0.0 |
| 1996 | 0.0 | 0.0 | 0.0 | 0.0 | 0.0 | 0.0 | 0.0 | 0.0 | 0.0 | 1.0 | 0.0 |
| 1995 | 0.0 | 0.0 | 0.0 | 0.0 | 0.0 | 0.0 | 0.0 | 0.0 | 0.0 | 0.0 | 0.0 |
| 1994 | 0.0 | 0.0 | 0.0 | 0.0 | 0.0 | 0.0 | 0.0 | 0.0 | 0.0 | 0.0 | 0.0 |
| 1993 | 0.0 | 0.0 | 0.0 | 0.0 | 0.0 | 0.0 | 0.0 | 0.0 | 0.0 | 0.0 | 0.0 |
| 1992 | 0.0 | 0.0 | 0.0 | 0.0 | 1.0 | 0.0 | 0.0 | 0.0 | 0.0 | 0.0 | 0.0 |
| 1991 | 0.0 | 0.0 | 0.0 | 0.0 | 0.0 | 0.0 | 0.0 | 0.0 | 0.0 | 0.0 | 0.0 |
| 1990 | 0.0 | 0.0 | 0.0 | 0.0 | 0.0 | 0.0 | 0.0 | 1.0 | 0.0 | 0.0 | 0.0 |
| 1989 | 0.0 | 0.0 | 0.0 | 0.0 | 0.0 | 0.0 | 0.0 | 2.0 | 0.0 | 0.0 | 0.0 |
| 1988 | 0.0 | 0.0 | 0.0 | 0.0 | 0.0 | 0.0 | 0.0 | 0.0 | 0.0 | 0.0 | 0.0 |
| 1987 | 0.0 | 0.0 | 0.0 | 0.0 | 0.0 | 0.0 | 0.0 | 0.0 | 0.0 | 1.0 | 0.0 |
| 1986 | 0.0 | 0.0 | 0.0 | 0.0 | 0.0 | 0.0 | 0.0 | 0.0 | 0.0 | 0.0 | 0.0 |
| 1985 | 0.0 | 0.0 | 0.0 | 0.0 | 0.0 | 0.0 | 0.0 | 0.0 | 0.0 | 0.0 | 0.0 |
| 1984 | 0.0 | 0.0 | 0.0 | 0.0 | 0.0 | 0.0 | 0.0 | 0.0 | 0.0 | 0.0 | 0.0 |
| 1983 | 0.0 | 0.0 | 0.0 | 0.0 | 0.0 | 0.0 | 0.0 | 0.0 | 0.0 | 0.0 | 0.0 |
| 1982 | 0.0 | 0.0 | 0.0 | 0.0 | 0.0 | 0.0 | 0.0 | 0.0 | 0.0 | 0.0 | 0.0 |
Distribution map
Distribution - 2017
This map shows the observed distribution of the Rose Robin for 2017.
The red circles are the grid cells where Rose Robin have been reported.
The transparency of the red circles indicate how many surveys sheets were submitted for that grid cell; the darker the red the more reliable the data. Of the 315 grid cells with reports, 83 had only one sheet; an example is grid number A11.
The size of the circle represents the reporting rate. The maximum reporting rate for Rose Robin was 50.0% (eg grid number D17) and the minimum was 0.1% (eg grid number L14). 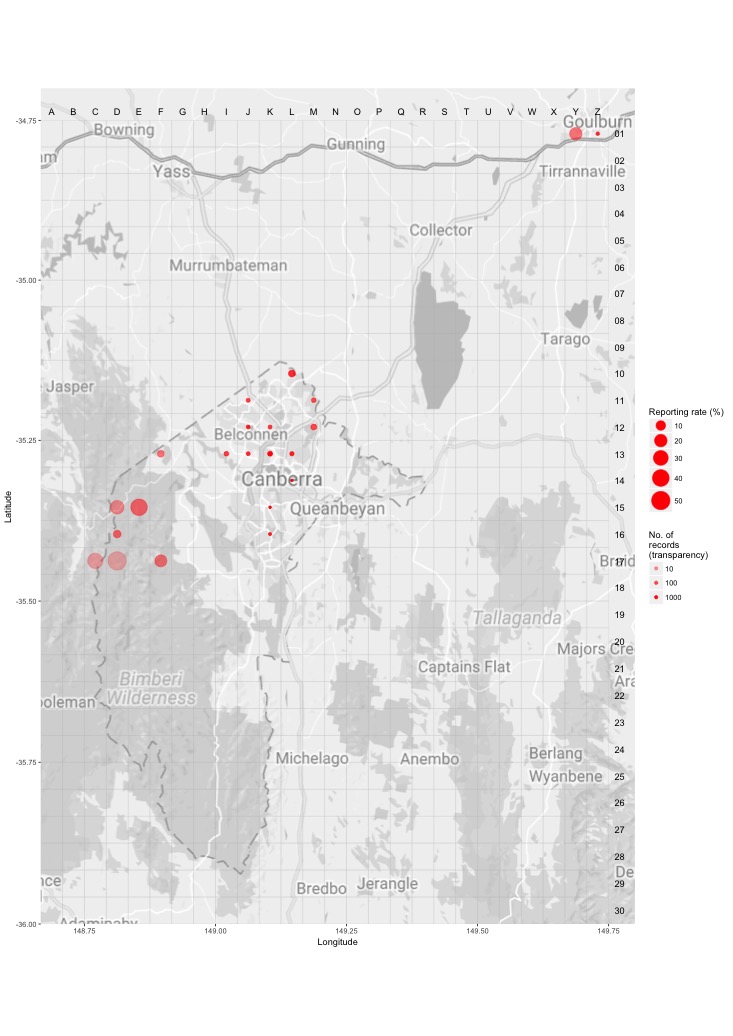
Distribution - all years
This map shows the observed distribution of the Rose Robin for all years.
The red circles are the grid cells where Rose Robin have been reported.
The transparency of the red circles indicate how many surveys sheets were submitted for that grid cell; the darker the red the more reliable the data. Of the 703 grid cells with reports, 55 had only one sheet; an example is grid number U25.
The size of the circle represents the reporting rate. The maximum reporting rate for Rose Robin was 100.0% (eg grid number U25) and the minimum was 0.1% (eg grid number L15). 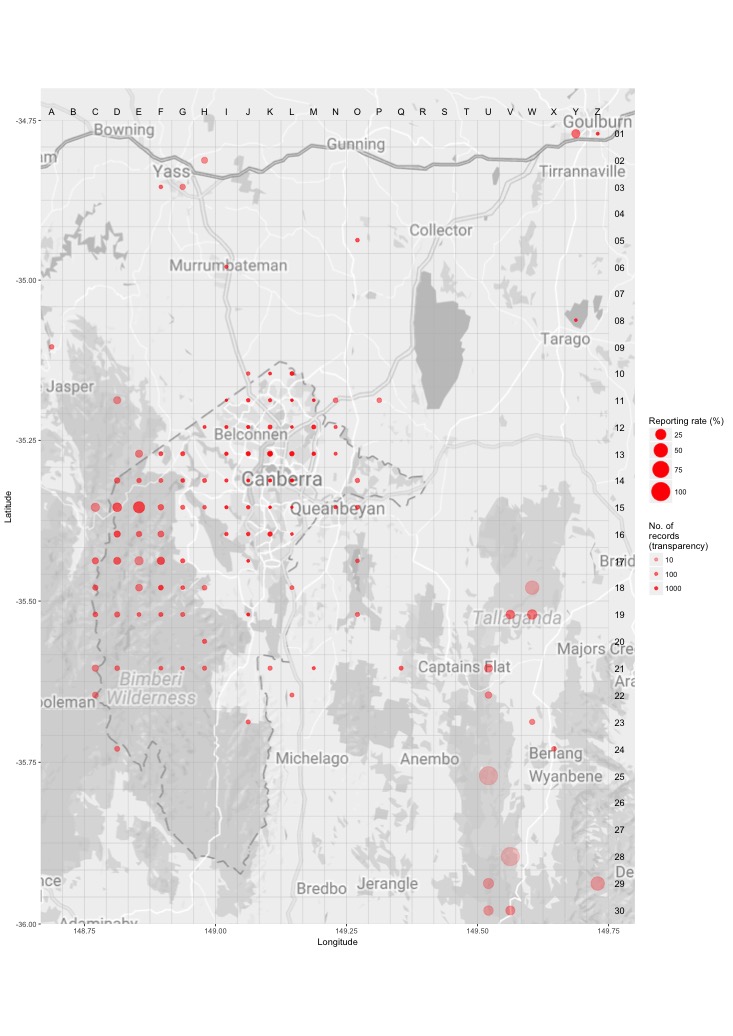
Breeding map
Breeding - 2017
This map shows the breeding distribution of the Rose Robin for 2017.
The red circles are the grid cells where breeding activity for Rose Robin have been reported.
The size of the circle represents the number of reports. 
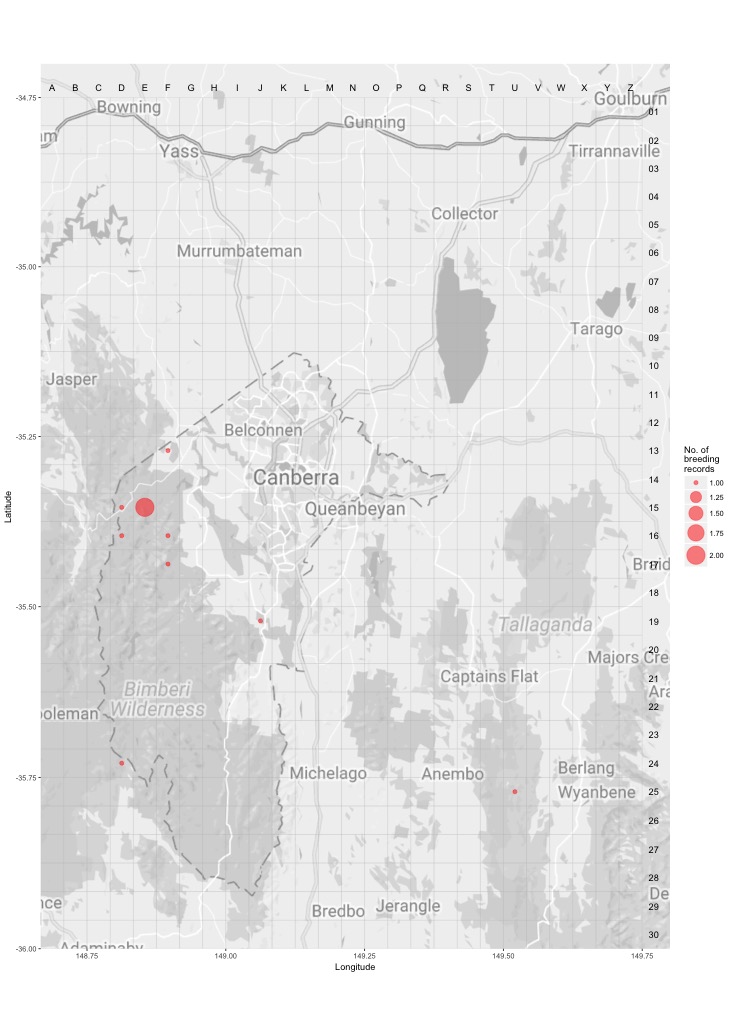
Breeding - all years
This map shows the breeding distribution of the Rose Robin for all years.
The red circles are the grid cells where breeding activity for Rose Robin have been reported.
The size of the circle represents the number of reports.